Add timestamps to frames
add_timestamps.RdThis function adds timestamps to frames created with frames_spatial.
Usage
add_timestamps(
  frames,
  x = NULL,
  y = NULL,
  format = "%Y-%m-%d %H:%M:%S",
  ...,
  verbose = TRUE
)
Arguments
- frames
an object of class
moveViscreated withframes_spatial.- x
numeric, optional, position of timestamps on the x scale. By default, timestamps will be displayed in the top center.
- y
numeric, optional, position of timestamps on the y scale.
- format
character, optional, format of timestamps to be displayed in, passed to
strftime).- ...
optional, arguments passed to
add_text, such ascolour,size,type.- verbose
logical, if
TRUE, messages and progress information are displayed on the console (default).
Examples
library(moveVis)
library(move2)
library(terra)
data("move_data", package = "moveVis")
r <- readRDS(example_data(file = "raster_NDVI.rds"))
# align movement
m <- align_move(move_data, res = units::set_units(4, "min"))
#> Temporal resolution of 4 [min] is used to align trajectories.
# create frames and add timestamps as text
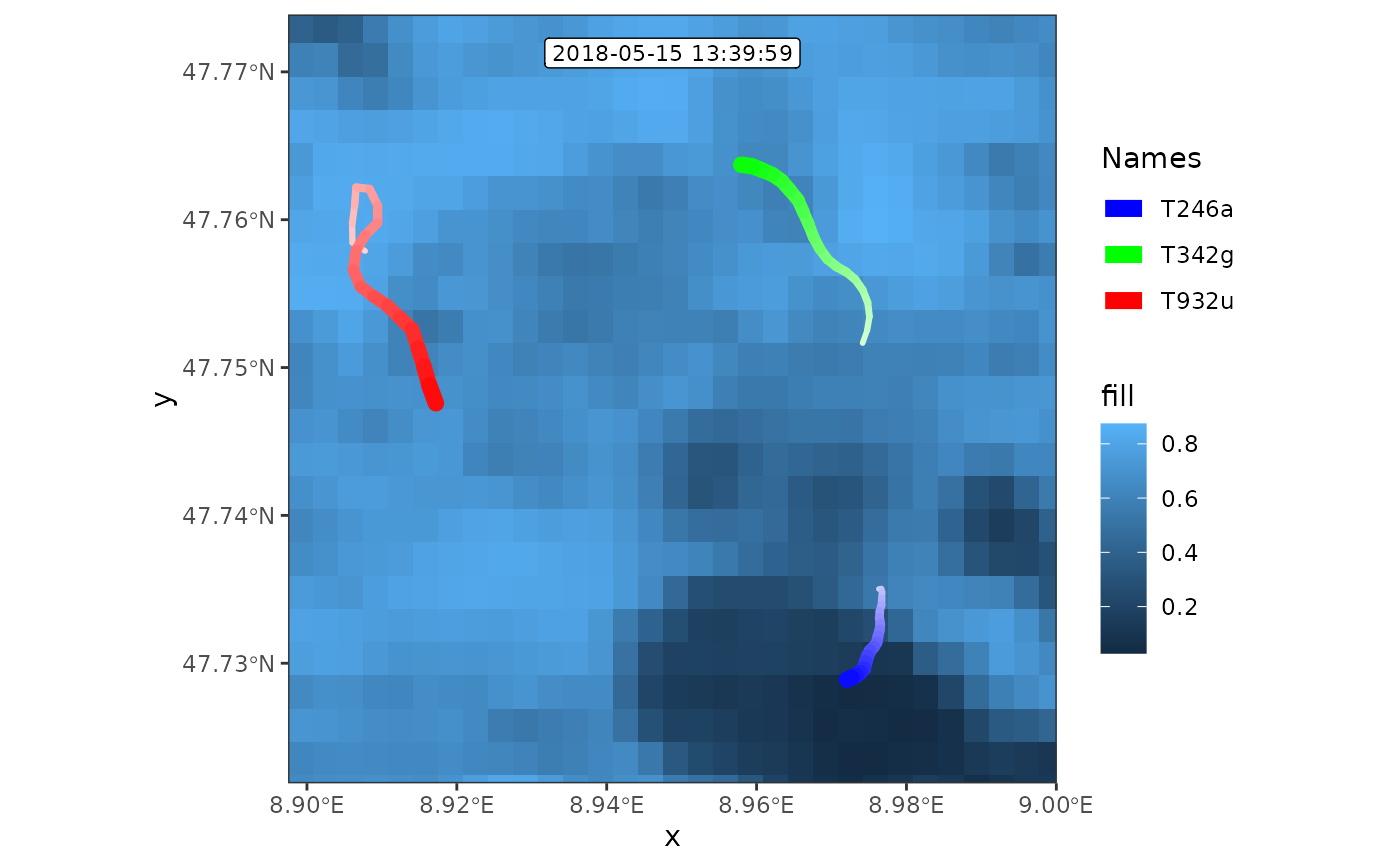
frames <- frames_spatial(m, r, r_type = "gradient", fade_raster = TRUE) %>%
add_timestamps(type = "text")
#> Processing input data...
#> Approximated animation duration: ≈ 7.52s at 25 fps using 188 frames
#> CRS (geodetic): WGS 84
#> Assigning raster maps to frames...
frames[[100]]
 # or use the ggplot2 "label" type:
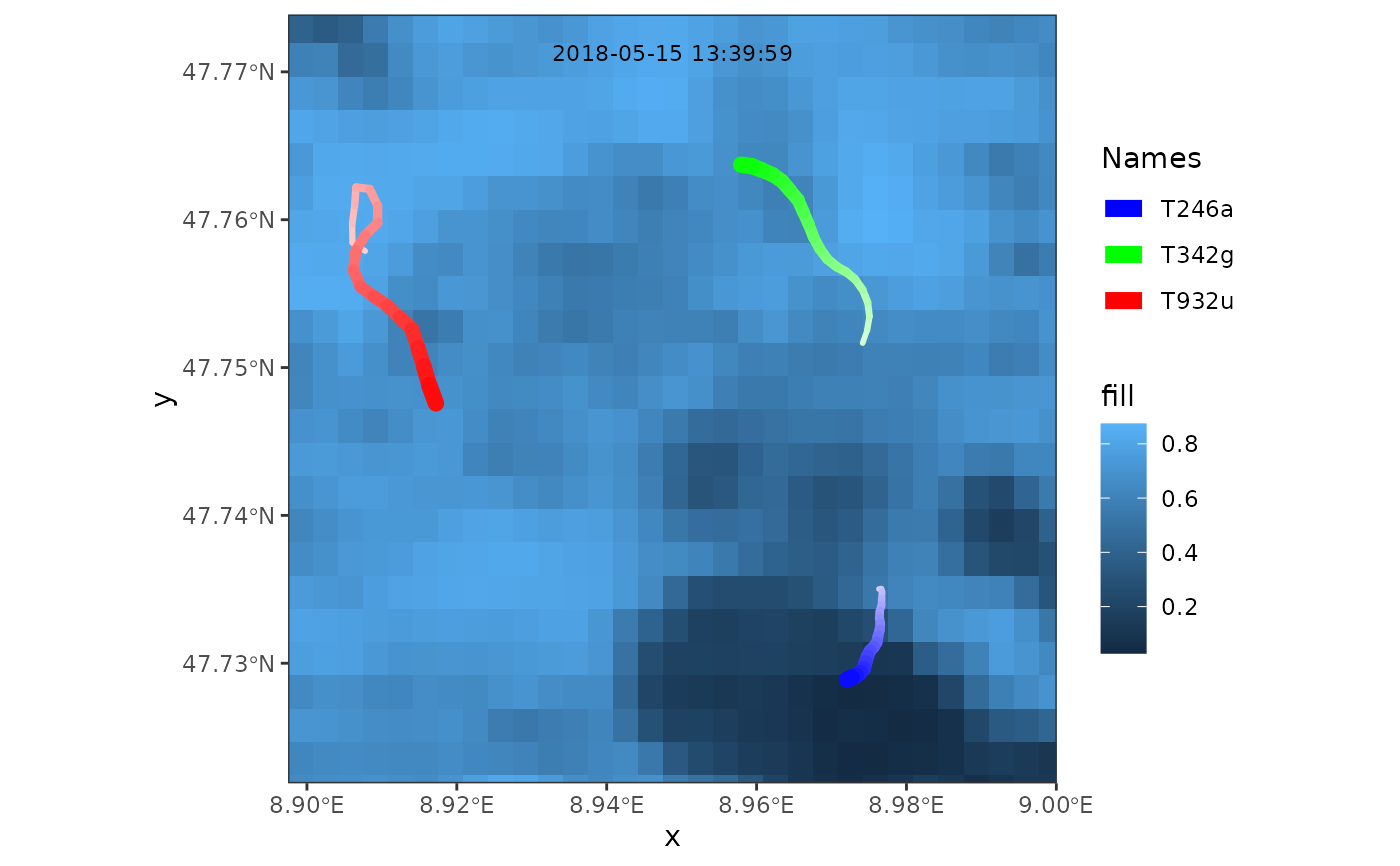
frames <- frames_spatial(m, r, r_type = "gradient", fade_raster = TRUE) %>%
add_timestamps(type = "label")
#> Processing input data...
#> Approximated animation duration: ≈ 7.52s at 25 fps using 188 frames
#> CRS (geodetic): WGS 84
#> Assigning raster maps to frames...
frames[[100]]
# or use the ggplot2 "label" type:
frames <- frames_spatial(m, r, r_type = "gradient", fade_raster = TRUE) %>%
add_timestamps(type = "label")
#> Processing input data...
#> Approximated animation duration: ≈ 7.52s at 25 fps using 188 frames
#> CRS (geodetic): WGS 84
#> Assigning raster maps to frames...
frames[[100]]