Create frames of spatial movement maps for animation
frames_spatial.Rdframes_spatial creates frames from movement and map/raster data. If no custom raster data is provided, a basemap is pulled from a map tile service using the basemaps package. Frames are returned as an object of class moveVis and can be subsetted, viewed (see render_frame), modified (see add_gg and associated functions ) and animated (see animate_frames).
Usage
frames_spatial(
  m,
  r = NULL,
  r_type = "gradient",
  fade_raster = FALSE,
  crop_raster = TRUE,
  map_service = "osm",
  map_type = "streets",
  map_res = 1,
  map_token = NULL,
  map_dir = NULL,
  margin_factor = 1.1,
  equidistant = NULL,
  ext = NULL,
  crs = if (is.null(r)) st_crs(3857) else st_crs(terra::crs(r)),
  crs_graticule = st_crs(4326),
  path_size = 3,
  path_end = "round",
  path_join = "round",
  path_mitre = 10,
  path_arrow = NULL,
  path_colours = NA,
  path_alpha = 1,
  path_fade = FALSE,
  path_legend = TRUE,
  path_legend_title = "Names",
  tail_length = 19,
  tail_size = 1,
  tail_colour = "white",
  trace_show = FALSE,
  trace_size = tail_size,
  trace_colour = "white",
  cross_dateline = FALSE,
  ...,
  verbose = TRUE
)
Arguments
- m
move2object of uniform time scale and time lag as returned byalign_move. Can contain a column namedcolourto control path colours (see details below).- r
terraobject, either aSpatRaster(mono-temporal) or aSpatRasterDataset(multi-temporal). In case of the latter, times of `r` must be defined as 'POSIXct' (seetimeand details below).- r_type
character, either
"gradient"or"discrete". Ignored, ifrcontains three bands, which are treated as RGB.- fade_raster
logical, if
TRUE,ris interpolated over time. IfFALSE,relements are assigned to those frames closest to the equivalent times ofr.- crop_raster
logical, whether to crop rasters in
rto frame extents before plotting or not.- map_service
character, a map service, e.g.
"osm". Useget_maptypesfor a list of available map services and types..- map_type
character, a map type, e.g.
"streets". Useget_maptypesfor available map services and types.- map_res
numeric, resolution of base map in range from 0 to 1.
- map_token
character, mapbox authentification token for mapbox basemaps. Register at https://www.mapbox.com/ to get a mapbox token. Mapbox is free of charge after registration for up to 50.000 map requests per month. Ignored, if
map_service = "osm".- map_dir
character, directory where downloaded basemap tiles can be stored. By default, a temporary directory is used. If you use moveVis often for the same area it is recommended to set this argument to a directory persistent throughout sessions (e.g. in your user folder), so that baesmap tiles that had been already downloaded by moveVis do not have to be requested again.
- margin_factor
numeric, factor relative to the extent of
mby which the frame extent should be increased around the movement area. Ignored, ifextis set.- equidistant
logical, whether to make the map extent equidistant (squared) with y and x axis measuring equal distances or not. Especially in polar regions of the globe it might be necessaray to set
equidistanttoFALSEto avoid strong stretches. By default (equidistant = NULL), equidistant is set automatically toFALSE, ifextis set, otherwiseTRUE. Read more in the details.- ext
sf bboxin same CRS asm, optional. If set, frames are cropped to this extent. If not set, the extent is computed fromm, optionally with a margin set bymargin_factor.- crs
sf crsobject. This is the CRS that is used for visualizing both movement and map data. Defaults tost_crs(3857)(Web Mercator), unlessris defined. In that case,st_crs(r)is used.- crs_graticule
sf crsobject. This is the CRS that should be used to generate graticules. By default, geographic coordinates (Lon/Lat WGS84, EPSG:4326) is used.- path_size
numeric, size of each path.
- path_end
character, either
"round","butt"or"square", indicating the path end style.- path_join
character, either
"round","mitre"or"bevel", indicating the path join style.- path_mitre
numeric, path mitre limit (number greater than 1).
- path_arrow
arrow, path arrow specification, as created by grid::arrow().
- path_colours
character, a vector of colours. Must be of same length as number of individual tracks in
mand refers to the order of tracks inm. If undefined (NA) andmcontains a column namedcolour, colours provided withinmare used (see details). Othwersie, colours are selected from a standard rainbow palette per individual track.- path_alpha
numeric, defines alpha (transparency) of the path. Value between 0 and 1. Default is 1.
- path_fade
logical, whether paths should be faded towards the last frame or not. Useful, if
trace_show = TRUEand you want to hold the last frame usingend_pauseinanimate_frames.- path_legend
logical, wether to add a path legend from
mor not. Legend tracks and colours will be ordered by the tracks' temporal apperances, not by their order inm.- path_legend_title
character, path legend title. Default is
"Names".- tail_length
numeric, length of tail per movement path.
- tail_size
numeric, size of the last tail element. Default is 1.
- tail_colour
character, colour of the last tail element, to which the path colour is faded. Default is "white".
- trace_show
logical, whether to show the trace of the complete path or not.
- trace_size
numeric, size of the trace. Default is same as
tail_size.- trace_colour
character, colour of the trace. Default is "white". It is recommended to define the same colours for both
trace_colourandtail_colourto enforce an uninterrupted colour transition form the tail to the trace.- cross_dateline
logical, whether tracks are crossing the dateline (longitude 180/-180) or not. If
TRUE, frames are expanded towards the side of the dateline that is smaller in space. Applies only if the CRS ofmis not projected (geographical, lon/lat). IfFALSE(default), frames are clipped at the minimum and maximum longitudes and tracks cannot cross.- ...
Additional arguments customizing the frame background:
alpha, numeric, background transparency (0-1).maxpixels, maximum number of pixels to be plotted per frame. Defaults to 500000. Reduce to decrease detail and increase rendering speeds.maxColorValue, numeric, only relevant for RGB backgrounds (i.e. ifr_type = "RGB"or if a default base map is used). Maximum colour value (e.g. 255). Defaults to maximum raster value.interpolate, logical, whether to spatially smooth the map raster (default isFALSE).
- verbose
logical, if
TRUE, messages and progress information are displayed on the console (default).
Details
If argument path_colours is not defined (set to NA), path colours can be defined by adding a character column named colour to m, containing a colour code or name per row (e.g. "red". This way, for example, column colour for all rows belonging to individual A can be set to "green", while column colour for all rows belonging to individual B can be set to "red".
Colours could also be arranged to change through time or by behavioural segments, geographic locations, age, environmental or health parameters etc. If a column name colour in m is missing, colours will be selected using path_colours or automatically. Call colours() to see all available colours in R.
Basemap colour scales can be changed/added using add_colourscale or by using ggplot2 commands (see examples). For continuous scales, use r_type = "gradient". For discrete scales, use r_type = "discrete".
If argument equidistant is set, the map extent is calculated (thus enlarged into one axis direction) to represent equal distances on the x and y axis.
Note
The use of some map services, e.g. "osm_stadia", "osm_thunderforest" or "mapbox", require registration to obtain an API token/key which can be supplied to map_token. See get_maptypes for details.
The Coordinate Reference System defined by argument crs is treated as target projection. Both m, basemaps accessed through a map service, or custom imagery provided through argument r will be reprojected into crs. The default CRS is Web Mercator (EPSG 3857), which guarantees undistorted map labels in web basemap imagery.
Examples
library(moveVis)
library(move2)
library(terra)
# Example using multi-temporal raster data as basemap
data("move_data")
# align movement
m <- align_move(move_data, res = units::set_units(4, "min"))
#> Temporal resolution of 4 [min] is used to align trajectories.
# get available map types
get_maptypes()
#> $osm
#> [1] "streets" "streets_de" "topographic"
#>
#> $osm_stamen
#> [1] "toner" "toner_bg" "terrain" "terrain_bg" "watercolor"
#>
#> $osm_stadia
#> [1] "alidade_smooth" "alidade_smooth_dark" "outdoors"
#> [4] "osm_bright"
#>
#> $osm_thunderforest
#> [1] "cycle" "transport" "landscape" "outdoors"
#> [5] "transport_dark" "spinal" "pioneer" "mobile_atlas"
#> [9] "neighbourhood" "atlas"
#>
#> $carto
#> [1] "light" "light_no_labels" "light_only_labels"
#> [4] "dark" "dark_no_labels" "dark_only_labels"
#> [7] "voyager" "voyager_no_labels" "voyager_only_labels"
#> [10] "voyager_labels_under"
#>
#> $mapbox
#> [1] "streets" "outdoors" "light" "dark" "satellite" "hybrid"
#> [7] "terrain"
#>
#> $esri
#> [1] "natgeo_world_map"
#> [2] "usa_topo_maps"
#> [3] "world_imagery"
#> [4] "world_physical_map"
#> [5] "world_shaded_relief"
#> [6] "world_street_map"
#> [7] "world_terrain_base"
#> [8] "world_topo_map"
#> [9] "world_dark_gray_base"
#> [10] "world_dark_gray_reference"
#> [11] "world_light_gray_base"
#> [12] "world_light_gray_reference"
#> [13] "world_hillshade_dark"
#> [14] "world_hillshade"
#> [15] "world_ocean_base"
#> [16] "world_ocean_reference"
#> [17] "antarctic_imagery"
#> [18] "arctic_imagery"
#> [19] "arctic_ocean_base"
#> [20] "arctic_ocean_reference"
#> [21] "world_boundaries_and_places_alternate"
#> [22] "world_boundaries_and_places"
#> [23] "world_reference_overlay"
#> [24] "world_transportation"
#> [25] "delorme_world_base_map"
#> [26] "world_navigation_charts"
#>
#> $maptiler
#> [1] "aquarelle" "backdrop" "basic" "bright" "dataviz" "landscape"
#> [7] "ocean" "outdoor" "satellite" "streets" "toner" "topo"
#> [13] "winter"
#>
# with osm topographic base map
if (FALSE) { # \dontrun{
frames <- frames_spatial(
m, map_service = "osm", map_type = "topographic",
alpha = 0.5
)
# take a look at one of the frames, e.g. the 100th
frames[[100]]
frames <- frames %>%
add_northarrow(position = "bottomleft") %>%
add_scalebar(colour = "black", position = "bottomright") %>%
add_progress() %>%
add_timestamps(type = "label")
frames[[100]]
# animate frames as GIF
out_file <- tempfile(fileext = ".gif")
animate_frames(frames, out_file = out_file)
browseURL(out_file) # view animation
# use a larger margin around extent
frames <- frames_spatial(
m, map_service = "osm", map_type = "topographic", alpha = 0.5,
margin_factor = 1.8
)
frames[[100]] # take a look
# use a extent object as your AOI
ext <- sf::st_bbox(move_data)
ext[["xmin"]] <- ext[["xmin"]] - (ext[["xmin"]]*0.03)
ext[["xmax"]] <- ext[["xmax"]] + (ext[["xmax"]]*0.03)
frames <- frames_spatial(
m, map_service = "osm", map_type = "topographic", alpha = 0.5,
ext = ext
)
frames[[100]]
# alter path appearance (make it longer and bigger)
frames <- frames_spatial(
m, map_service = "osm", map_type = "topographic", alpha = 0.5,
path_size = 4, tail_length = 29
)
frames[[100]]
# adjust path colours manually
frames <- frames_spatial(
m, map_service = "osm", map_type = "topographic", alpha = 0.5,
path_colours = c("black", "blue", "purple")
)
frames[[100]]
m$colour <- plyr::mapvalues(
as.character(mt_track_id(m)),
unique(mt_track_id(m)), c("orange", "purple", "darkgreen")
)
frames <- frames_spatial(
m, map_service = "osm", map_type = "topographic", alpha = 0.5
)
frames[[100]]
} # }
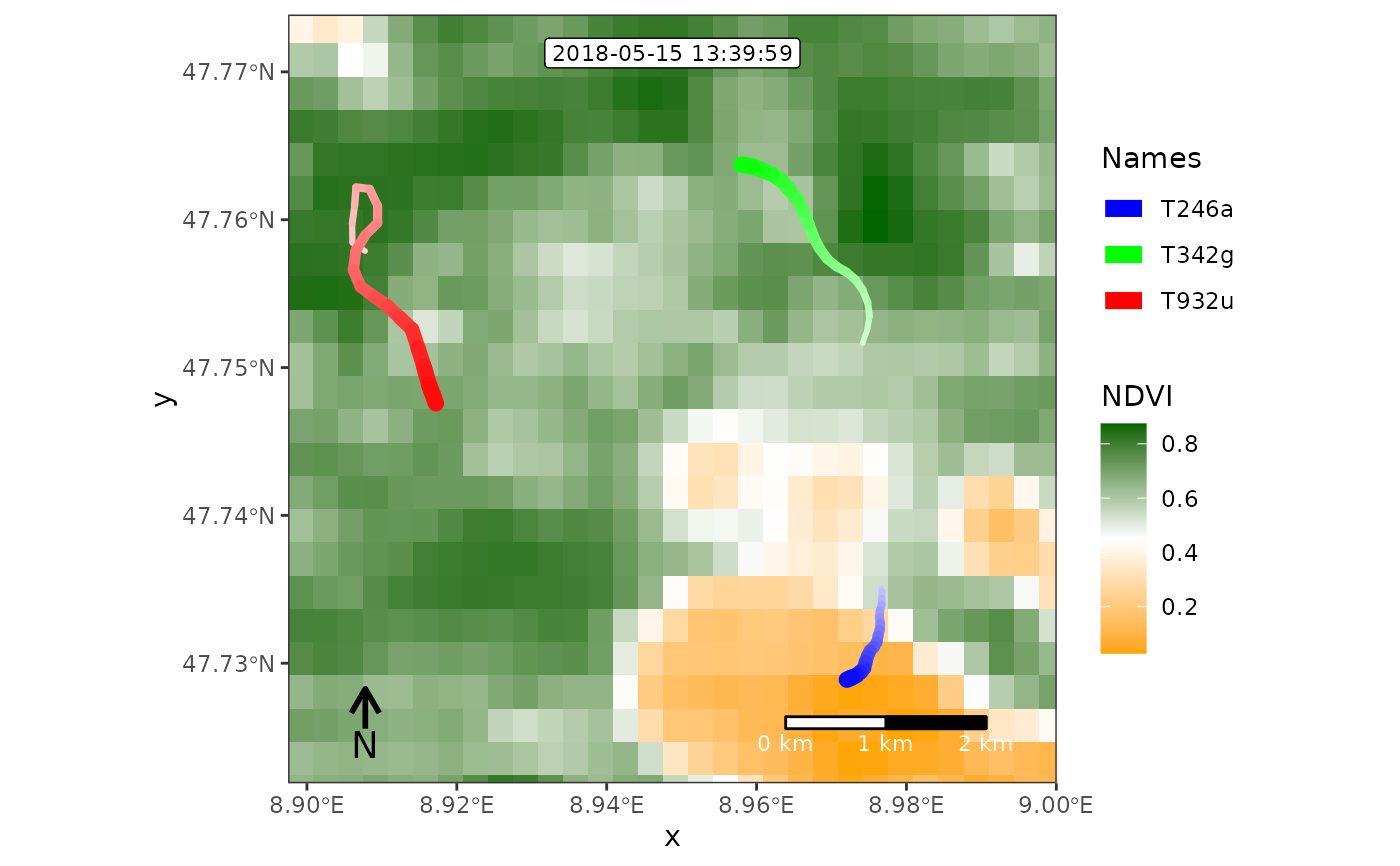
# create frames from custom (multi-temporal) basemaps
r <- readRDS(example_data(file = "raster_NDVI.rds"))
# timestamps of each raster are stored in the SpatRasterDataset:
time(r)
#> [[1]]
#> [1] "2018-05-15 07:00:00 UTC"
#>
#> [[2]]
#> [1] "2018-05-15 08:20:23 UTC"
#>
#> [[3]]
#> [1] "2018-05-15 09:44:48 UTC"
#>
#> [[4]]
#> [1] "2018-05-15 11:09:12 UTC"
#>
#> [[5]]
#> [1] "2018-05-15 12:33:37 UTC"
#>
#> [[6]]
#> [1] "2018-05-15 13:54:01 UTC"
#>
#> [[7]]
#> [1] "2018-05-15 15:18:25 UTC"
#>
#> [[8]]
#> [1] "2018-05-15 16:42:50 UTC"
#>
#> [[9]]
#> [1] "2018-05-15 18:07:15 UTC"
#>
#> [[10]]
#> [1] "2018-05-15 19:31:39 UTC"
#>
# create frames
frames <- frames_spatial(
m, r = r, r_type = "gradient",
fade_raster = TRUE
)
#> Processing input data...
#> Approximated animation duration: ≈ 7.52s at 25 fps using 188 frames
#> CRS (geodetic): WGS 84
#> Assigning raster maps to frames...
# customize
frames <- frames %>%
add_colourscale(
type = "gradient", colours = c("orange", "white", "darkgreen"),
legend_title = "NDVI") %>%
add_northarrow(position = "bottomleft") %>%
add_scalebar(colour = "white", position = "bottomright") %>%
add_progress() %>%
add_timestamps(type = "label")
# render a single frame
frames[[100]]
 # check available animation file formats
suggest_formats()
#> [1] "gif" "mov" "mp4" "flv" "avi" "mpeg" "3gp" "ogg"
if (FALSE) { # \dontrun{
# animate frames as GIF
out_file <- tempfile(fileext = ".gif")
animate_frames(frames, out_file = out_file)
browseURL(out_file) # view animation
# animate frames as mov
out_file <- tempfile(fileext = ".mov")
animate_frames(frames, out_file = out_file)
browseURL(out_file) # view animation
} # }
# check available animation file formats
suggest_formats()
#> [1] "gif" "mov" "mp4" "flv" "avi" "mpeg" "3gp" "ogg"
if (FALSE) { # \dontrun{
# animate frames as GIF
out_file <- tempfile(fileext = ".gif")
animate_frames(frames, out_file = out_file)
browseURL(out_file) # view animation
# animate frames as mov
out_file <- tempfile(fileext = ".mov")
animate_frames(frames, out_file = out_file)
browseURL(out_file) # view animation
} # }