Customizing frames
example-2.RmdNote: This vignette has not yet been updated to the most recent
moveVis version. Displayed code will likely not work as it
relies on deprecated dependencies such as move (replaced by
move2) or raster (replaced by
terra). For details, see the help pages of
moveVis and the README as those resources have already been
updated.
moveVis is entirely based on the ggplot2
grammar of graphics. Each moveVis frame is rendered as a
ggplot2 object that represents a single animation frame.
Thus, it is possible to customize each frame individually using
ggplot2 functions. Also, moveVis provides a
set of functions for making it easier to customize frames. Let’s create
some moveVis frames and change their apperance:
library(moveVis)
library(move2)
library(sf)
library(ggplot2)

data("move_data")

# align movement tracks
move_data <- align_move(move_data, res = units::set_units(4, "min"))

# create frames
frames <- frames_spatial(move_data, path_colours = c("red", "green", "blue"),
                         map_service = "osm", map_type = "topographic", alpha = 0.5)

# edit frames
frames <- add_labels(frames, x = "Longitude", y = "Latitude") # add labels, e.g. axis labels
frames <- add_progress(frames) # add a progress bar
frames <- add_scalebar(frames, height = 0.015) # add a scale bar
frames <- add_northarrow(frames) # add a north arrow
frames <- add_timestamps(frames, type = "label") # add timestamps
Alternatively, use the pipe, which (in my opinion) makes this more elegant:
# edit frames
frames <- frames %>%
add_labels(x = "Longitude", y = "Latitude") %>% # add labels, e.g. axis labels
add_progress() %>% # add a progress bar
add_scalebar(height = 0.015) %>% # add a scale bar
add_northarrow() %>% # add a north arrow
add_timestamps(type = "label") # add timestamps
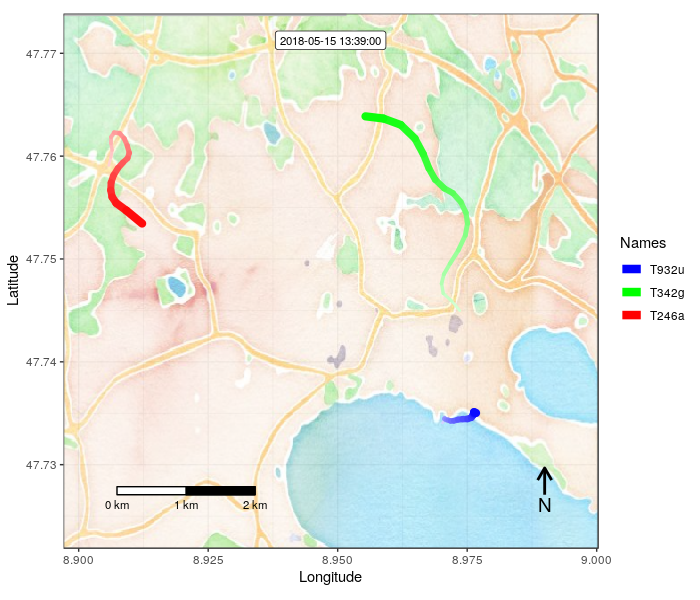
## Have a look at one of the frames:
frames[[100]]
It’s also possible to apply your own ggplot2 syntax to
frames, e.g. for drawing polygons, lines or points that are
static or change with time. Let’s start with editing a single frame. In
the following example, we create an sf polygon using
Lat/Lon coordinates (EPSG:4326), transform it to Pseudo Mercator (EPSG
3857) to match the Coordinate Reference System of default basemaps, and
add it to one individual frame:
data <- cbind(
  x = c(8.96, 8.955, 8.959, 8.963, 8.968, 8.963, 8.96),
  y = c(47.725, 47.728, 47.729, 47.728, 47.725, 47.723, 47.725)
)

data <- list(data) %>%
  st_polygon() %>%
  st_geometry() %>%
  st_as_sf(crs = st_crs(4326)) %>%
  st_transform(crs = st_crs(3857))

frame_edited <- frames[[100]] + geom_sf(
    data = data, colour = "red", fill = "transparent",
    linetype = "dashed", lwd = 1
) + coord_sf(expand = F)

frame_edited
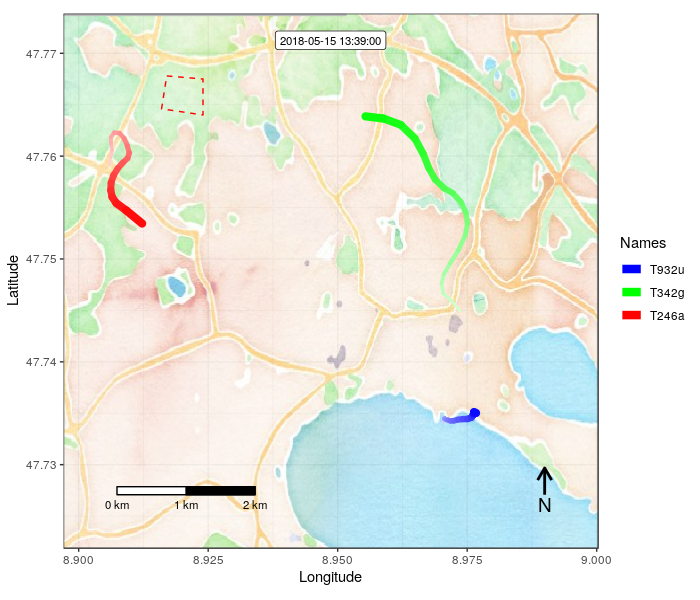
If you just want to change one or a small selection of frames, you
could just manipulate those frames like shown above and assign the
cusomized ggplot2 frames to the equivalent elements in your
frames list.
If you want to edit all frames, you can use the add_gg()
function. Here, we want to mark a field on the map on all frames. For
this, we use the geom_path() function of
ggplot2 with add_gg():
# or customize all frames at once using add_gg:
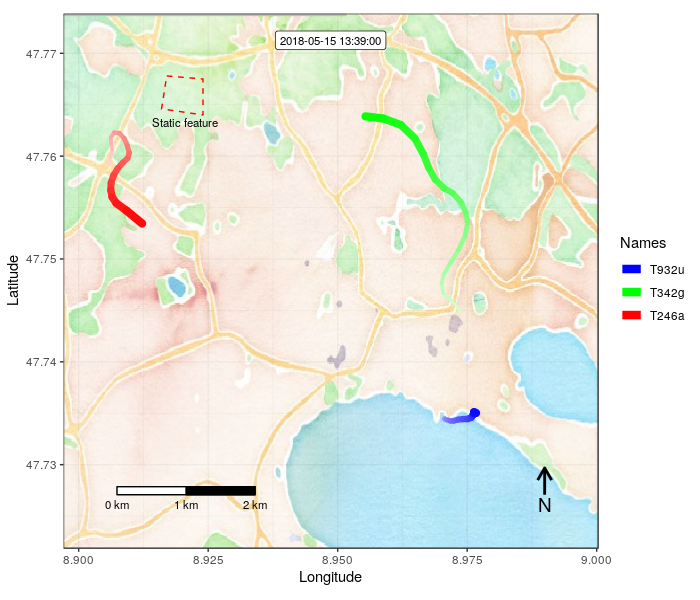
frames = add_gg(frames, gg = expr(geom_path(aes(x = x, y = y), data = data,
colour = "red", linetype = "dashed")), data = data)The field marking is now added to all frames. Let’s add some text to describe the field marking:
frames <- add_text(frames, "Static feature", x = 8.9205, y = 47.7633,
                   colour = "black", size = 3)

## Have a look at one of the frames:
frames[[100]]
add_gg() can also be used to customize each frame
consecutively, e.g. to add dynamic marks that move or change with time.
Both arguments gg and data can take lists of
the same length as frames. If one of these arguments or
both are lists, each list element is applied to the according element in
frames. Let’s add a another field mark that is slightly
changing with each frame:
## create data.frame containing corner coordinates
data <- data.frame(x = c(8.96, 8.955, 8.959, 8.963, 8.968, 8.963, 8.96),
y = c(47.725, 47.728, 47.729, 47.728, 47.725, 47.723, 47.725))
## make a list from it by replicating it by the length of frames
data <- rep(list(data), length.out = length(frames))
## now alter the coordinates to make them shift
data <- lapply(data, function(x){
y <- rnorm(nrow(x)-1, mean = 0.00001, sd = 0.0001)
x + c(y, y[1])
})
## draw each individual polygon to each frame
frames = add_gg(frames, gg = expr(geom_path(aes(x = x, y = y), data = data,
colour = "black")), data = data)
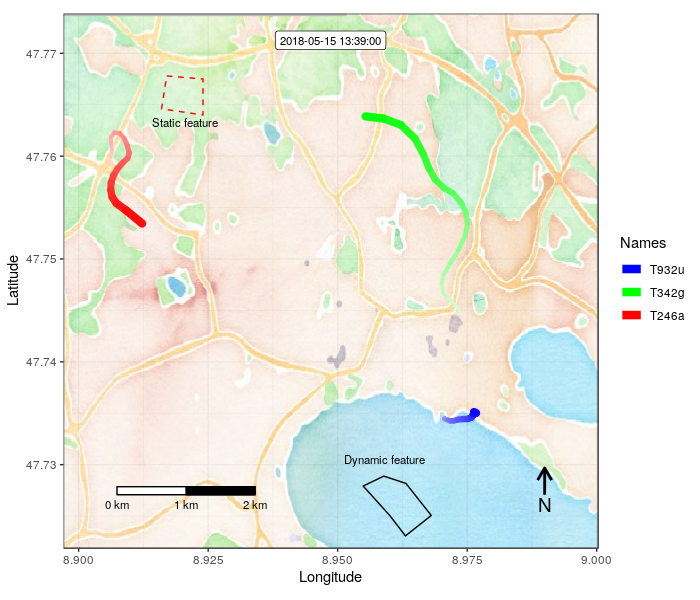
## add a text label
frames <- add_text(frames, "Dynamic feature", x = 8.959, y = 47.7305,
colour = "black", size = 3)
## Have a look at one of the frames:
frames[[100]]
Animate the the customized frames as we did in the prior section
using animate_frames().
animate_frames(frames, "/full/path/to/example_2.gif")