View movement tracks
example-7.RmdNote: This vignette has not yet been updated to the most recent
moveVis version. Displayed code will likely not work as it
relies on deprecated dependencies such as move (replaced by
move2) or raster (replaced by
terra). For details, see the help pages of
moveVis and the README as those resources have already been
updated.
With the simple view_spatial() wrapper, movement tracks
can be displayed on an interactive map using the very handy
mapview or leaflet packages. This may be
helpful if you want to explore data before animating them or check the
effect of applying correction methods as done by
align_move().
# in case, mapview or leaflet is not installed:
install.packages(c("leaflet", "mapview"))
library(moveVis)
library(move)
data("move_data")
# return a mapview map
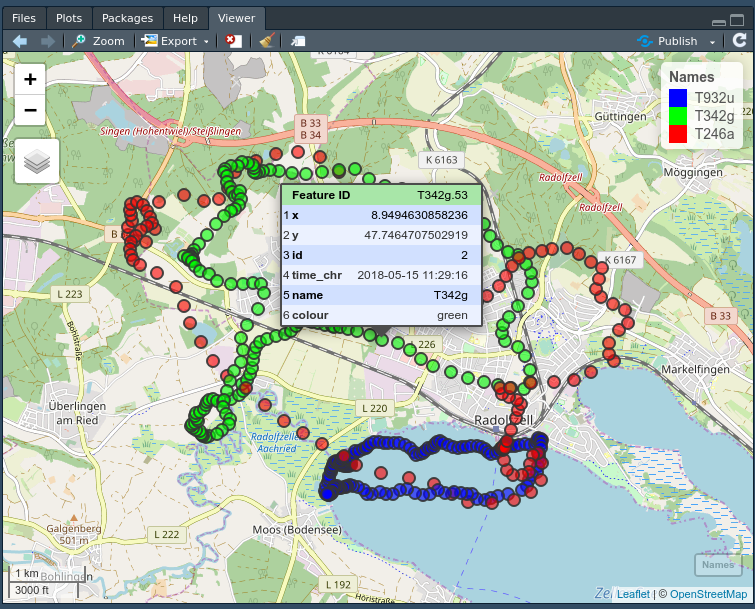
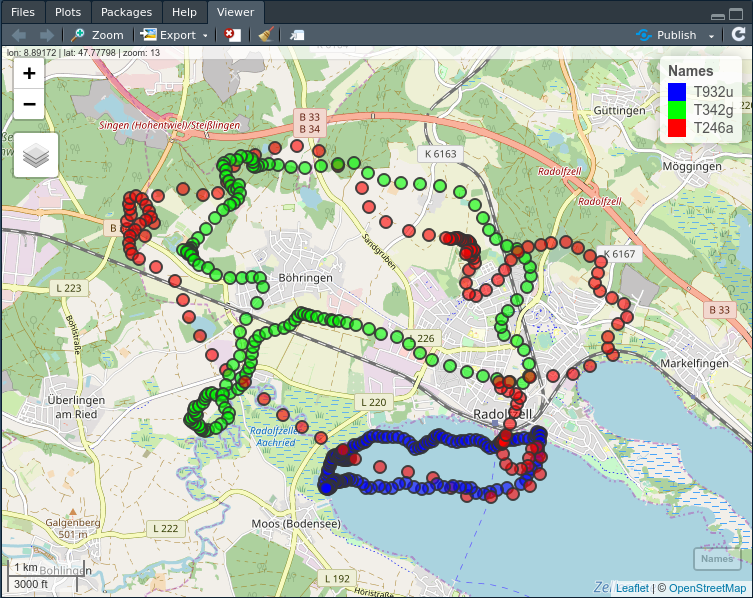
view_spatial(move_data)An interactive map is returned. If you use RStudio, it will be displayed on the RStudio viewer pane:
When hovering a point with the cursor, the timestamps of that point
is displayed. Thanks to mapview, you may click on a point
to open a pop-up box containing the point’s attributes: